 Skip to content
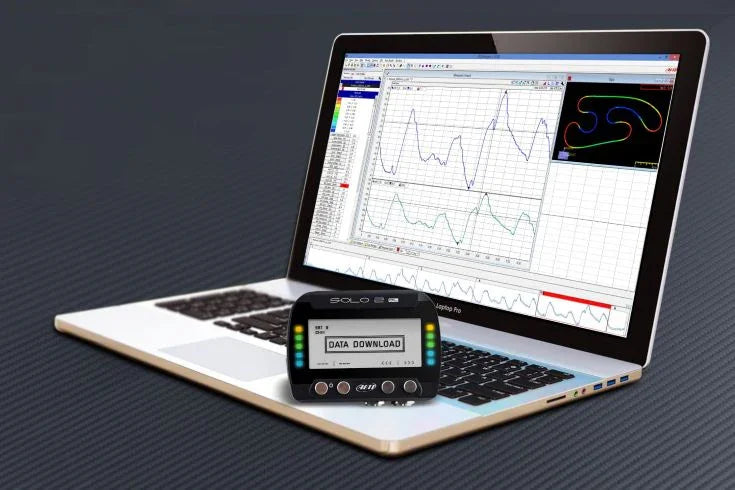
HPDE data analysis can turn a track day into a more focused learning loop. Lap times, GPS traces, speed traces, video, throttle and brake data, G-force plots, and session notes can help you understand where your driving is consistent, where it changes, and what to ask your instructor about next.
This refreshed guide makes it easier for HPDE drivers who want to review their session data without getting lost in every graph, channel, or gadget.
Quick Answer: What HPDE Drivers Should Look For
- Use data to find patterns, not to chase one hero lap
- Compare clean laps from similar conditions before drawing conclusions
- Review GPS traces to see line differences through corners
- Use speed traces to spot braking, minimum speed, and throttle timing differences
- Use video to explain what the graph cannot show, such as traffic, flags, point-bys, or missed references
- Pick one focus point for the next session and confirm it with your instructor
Why HPDE Data Analysis Matters
Stepping into HPDE data analysis can feel daunting at first. But even basic data can give you objective feedback about your performance on track. Instead of relying only on memory or “that felt faster,” you can compare what actually happened from lap to lap and uncover opportunities for measurable growth.
- Lap times can show consistency and broad improvement trends
- GPS traces can show whether your line changed from lap to lap
- Speed traces can show braking points, minimum speeds, and exit speed differences
- Throttle and brake traces can reveal hesitation, coasting, release timing, and corner-exit behavior
- Video can add context for traffic, flags, point-bys, vision, and reference points
- Instructor notes help guide what to look for and how to keep the analysis productive
For those with more advanced systems, additional channels such as steering angle, g-forces, and RPM can further enrich your understanding.
Learning to analyze your performance is not only about lap times. For HPDE drivers, the better goal is building repeatability, smoothness, confidence, and more useful questions for the next session.
What Data You Can Collect in HPDE
Modern technology makes motorsports data gathering more accessible than it used to be. Some drivers start with a phone app and session notes. Others use GPS lap timers, data loggers, OBD-connected tools, action cameras, or full video-and-data systems.
Beginner-friendly data
- Session notes
- Instructor comments
- In-car video
- Lap times
- Basic GPS trace review
Intermediate data
- Speed traces
- Minimum corner speeds
- Segment or sector times
- Throttle and brake timing
- GPS line overlays
Advanced channels
- Brake pressure
- Throttle position
- Steering angle
- RPM and gear data
- G-force and G-G diagrams
Start with what answers your question. More data channels do not automatically create better learning. A clear video, clean GPS trace, and instructor notes can be more useful than a complicated data file you do not yet know how to interpret.
A Simple HPDE Data Review Workflow
Data analysis might sound complex, but the basics are approachable. Whether you use a laptop, tablet, phone app, or logger software, start with a repeatable review process.
Step 1: Establish a Baseline
Before improvement comes measurement. Choose a session where you had clean laps, normal traffic, and no unusual flags or interruptions. Do not stress about dissecting every detail at first. Focus on finding laps that offer an honest picture of your current driving habits.
- Pick one clean session to review
- Identify two or three laps with similar traffic and conditions
- Write down what your instructor said about that session
- Compare one corner, braking zone, or section at a time
- Turn the review into one focus point for the next run
Step 2: Overlay and Compare Laps
With your baseline laps loaded, use your software’s compare or overlay feature to view two laps side by side. That might be your fastest lap versus a slower lap, or two consistent laps from the same session. Look for where speed traces deviate, braking zones change, or lines differ.
These moments do not automatically prove what you should do next, but they show where to ask better questions. Was the faster lap cleaner? Was there traffic? Did you turn in differently? Did you get back to throttle sooner? Did a later apex help, or did it just happen on a cleaner lap?
Step 3: Focus on Key Corners
Not every section of a track has the same priority. Use your lap overlay to find corners or braking zones where time is consistently lost. A single slow turn that leads onto a long straight can add more than a second to your overall time. Target these sections first for the biggest improvements.
Step 4: Isolate Inputs
If your data includes throttle and brake traces, use them to see how and when you used the pedals. You may find that you braked earlier than you thought, released the brake abruptly, coasted between brake and throttle, or applied throttle inconsistently on corner exit.
Step 5: Set Goals and Test
Use the data to define one or two priority improvements for the next session. Keep the goal specific and appropriate for your skill level. For example, you might focus on using the same brake marker more consistently, improving your corner exit, or confirming whether you are turning in too early. Review fresh data to see if your changes had the desired effect.
Do not let data override instruction
Use data to support coaching, not replace it. Braking later, carrying more speed, or changing line should always be considered within event rules, traffic, flags, run group expectations, vehicle condition, and instructor guidance.
Step 6: Compare With Other Drivers
If possible, compare your data to laps from a more experienced driver on the same track with the same or similar car, tires, modifications, and conditions. Reference laps can help, but they need context. A different car, tire, run group, or traffic situation can make these comparisons misleading.
Using Data Analysis to Improve Driving
Once you are comfortable with the collect, compare, and improve cycle, data becomes a useful part of your track-day learning process. The sections below show how common HPDE data views can help you review line, speed, inputs, and tire loading.
GPS Traces and the Racing Line
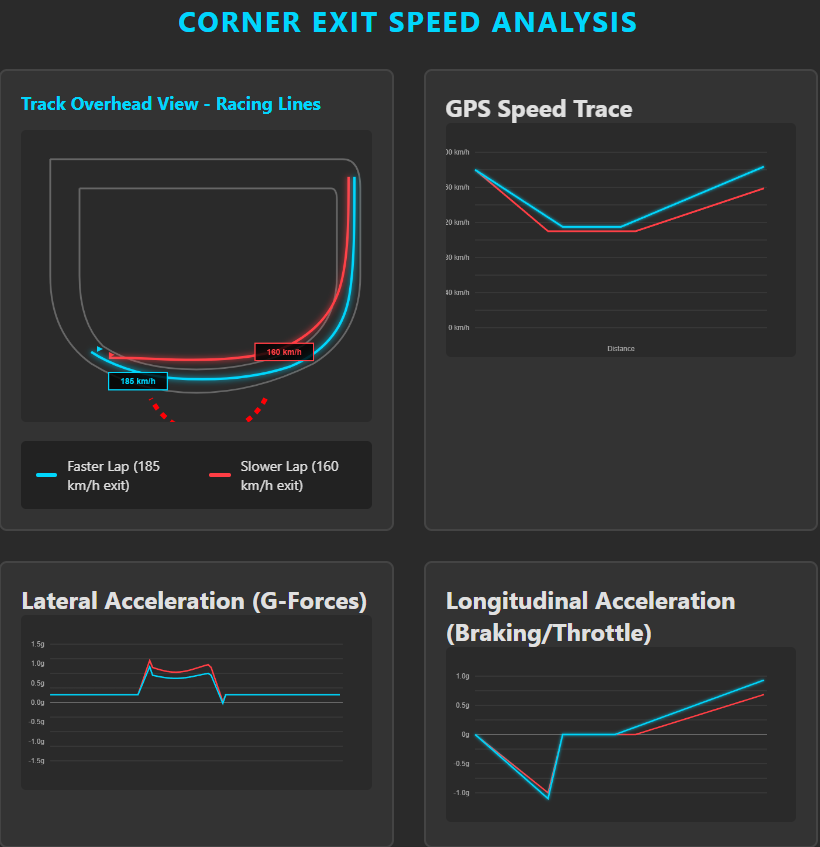
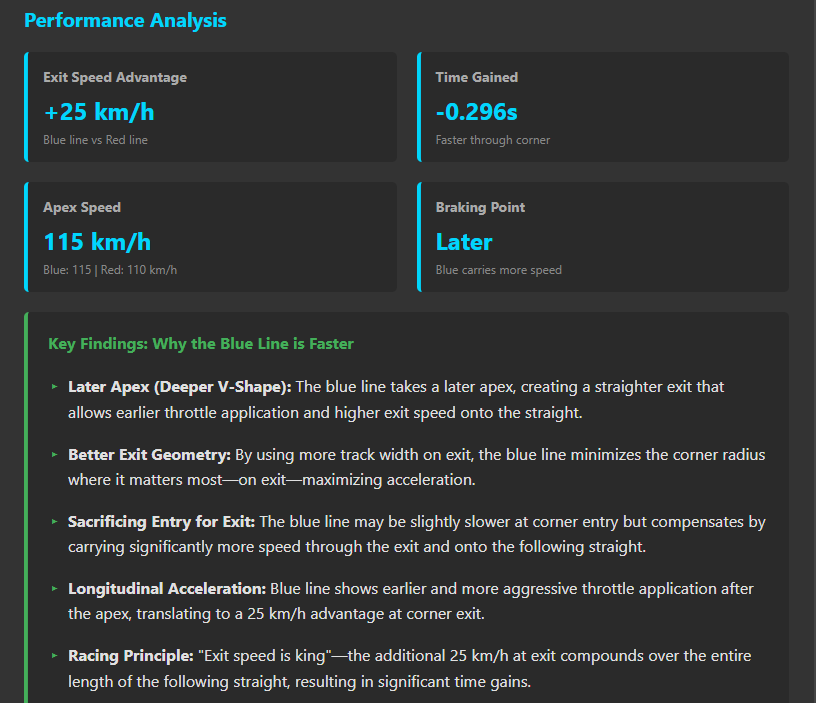
Overlaying GPS traces shows how different lines through a corner can affect speed and exit velocity. For example, a wider entry or later apex might help a driver carry more speed onto the following straight. Let the data confirm what works best for your driving style and car setup.
Speed Traces and Minimum Speed
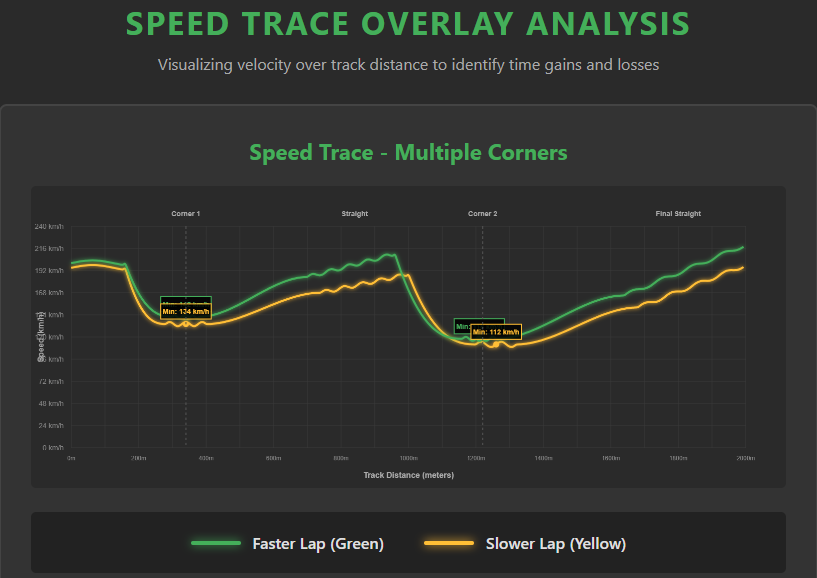
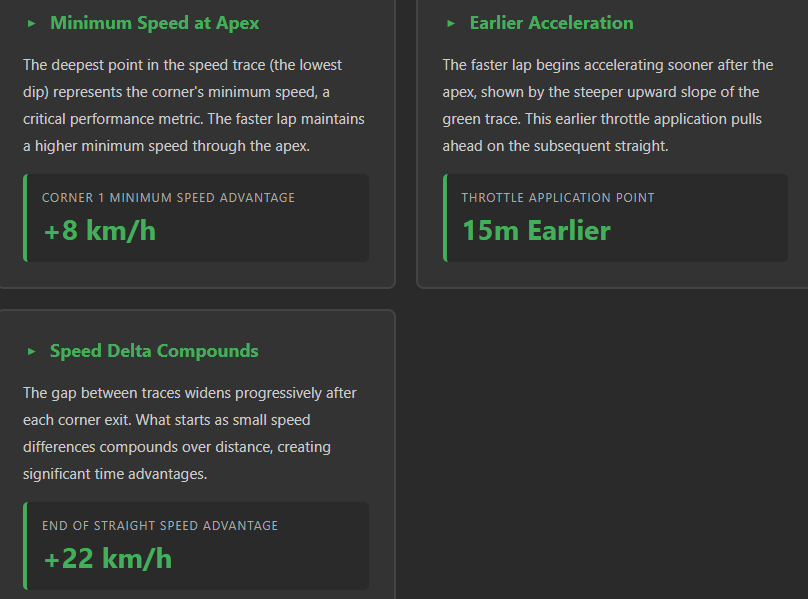
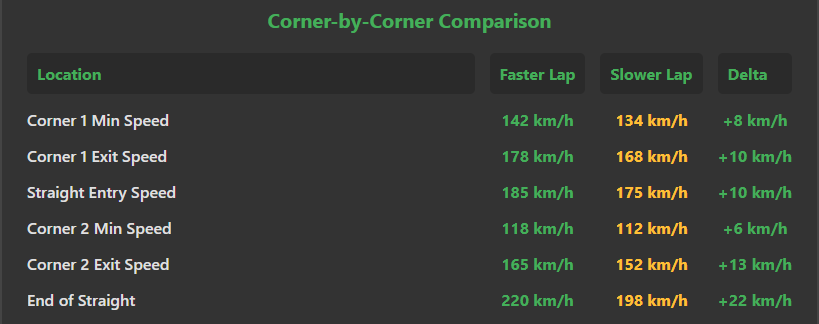
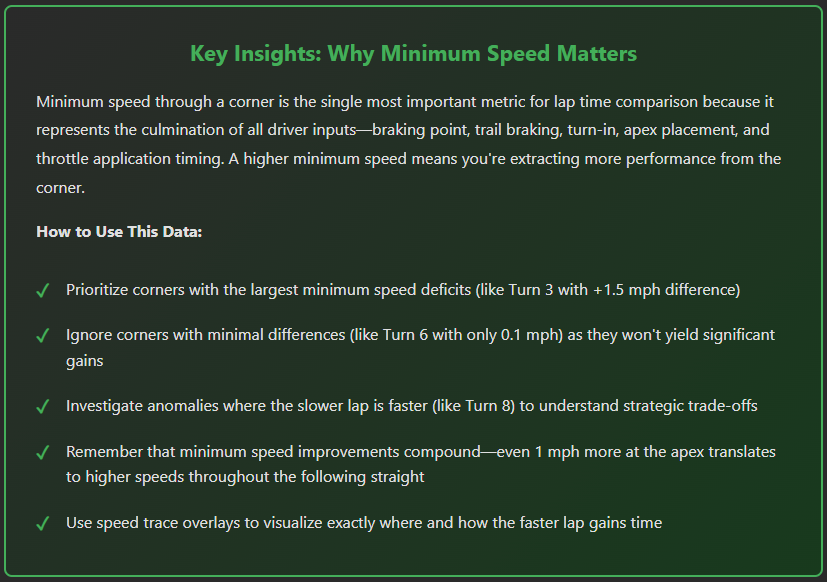
Speed traces show how your speed changes through the lap. For HPDE drivers, one of the easiest places to start is minimum speed through a corner. The lowest point in a speed trace often shows where the car was slowest during the turn.
Minimum Corner Speed Examples
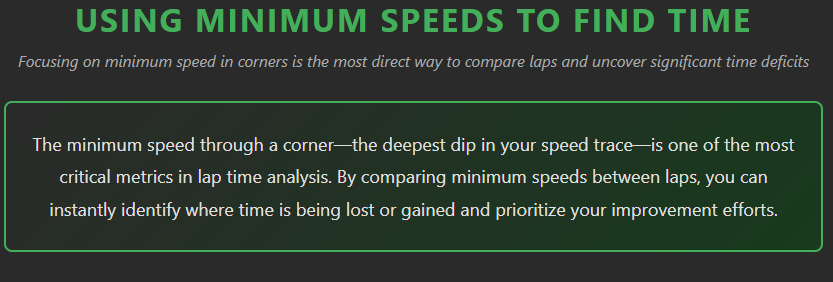
Focusing on minimum speed in a corner can be a direct way to compare laps and uncover possible time deficits. The key is to use it as a clue, not as a universal target. Every corner has a different priority, and the best answer usually depends on entry, rotation, exit, and what comes next.
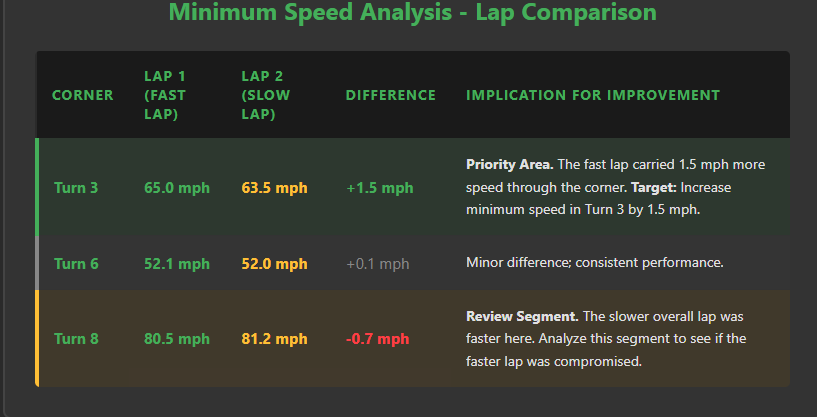
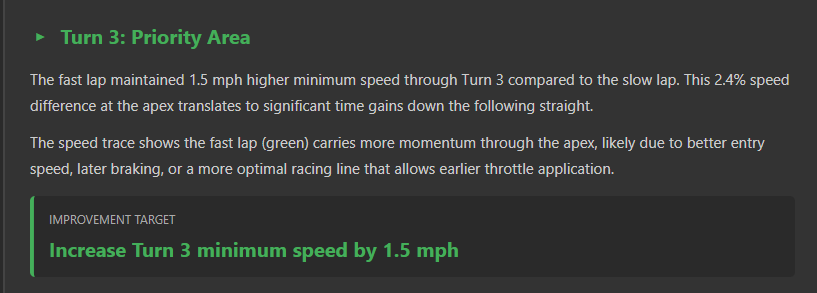
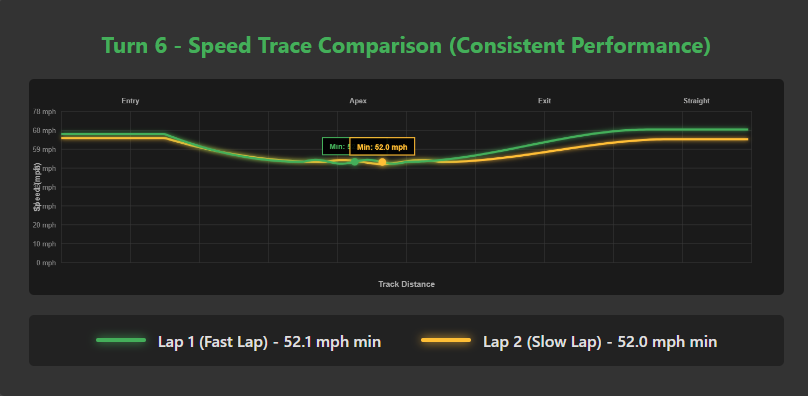
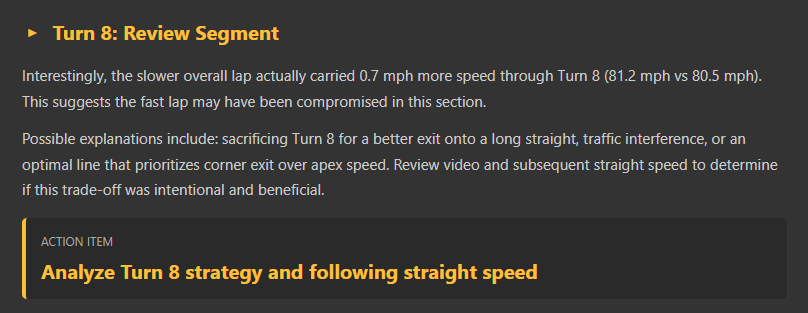
By overlaying speed traces, you can identify where time may be lost or gained. The more useful question is not simply “which minimum speed is higher?” It is “why did this lap carry or lose speed here, and did that help the exit?”
Throttle and Brake Traces
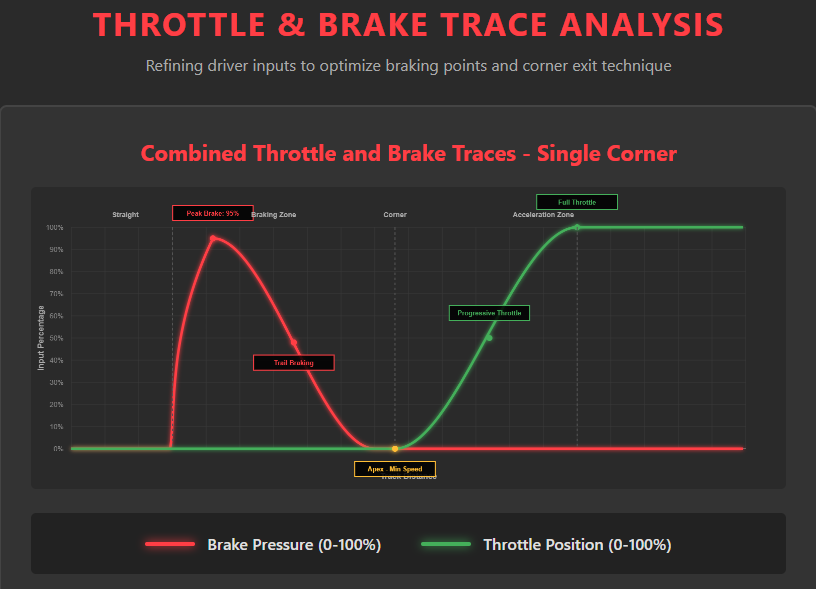
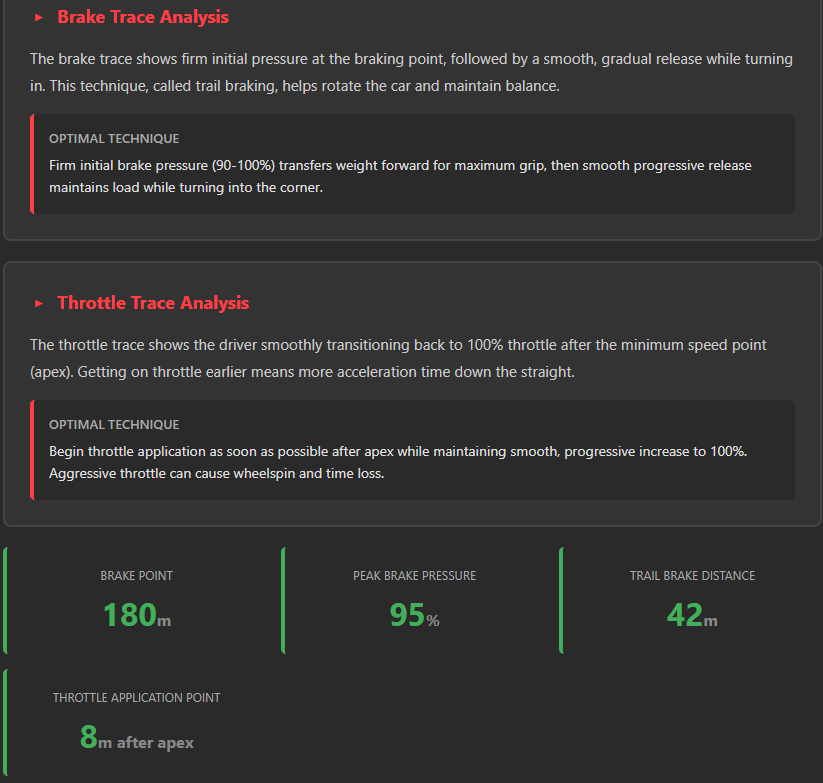
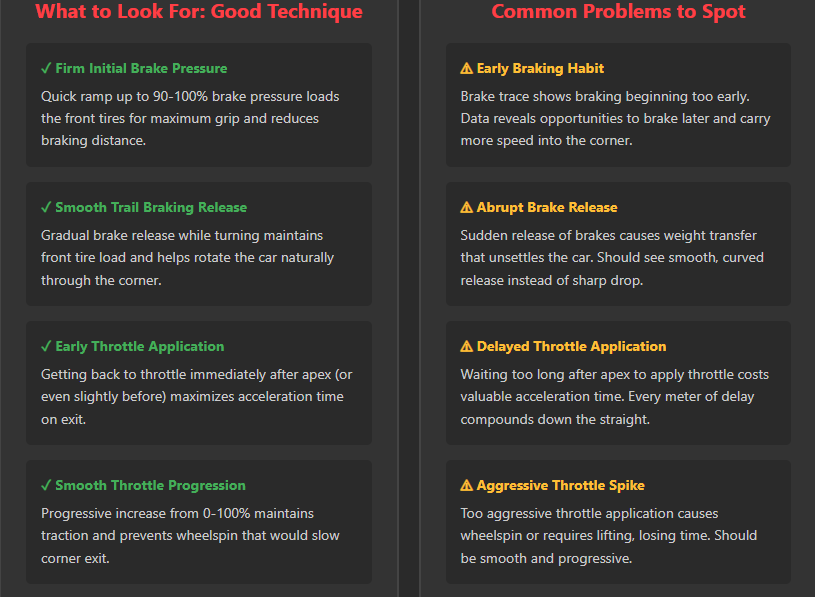
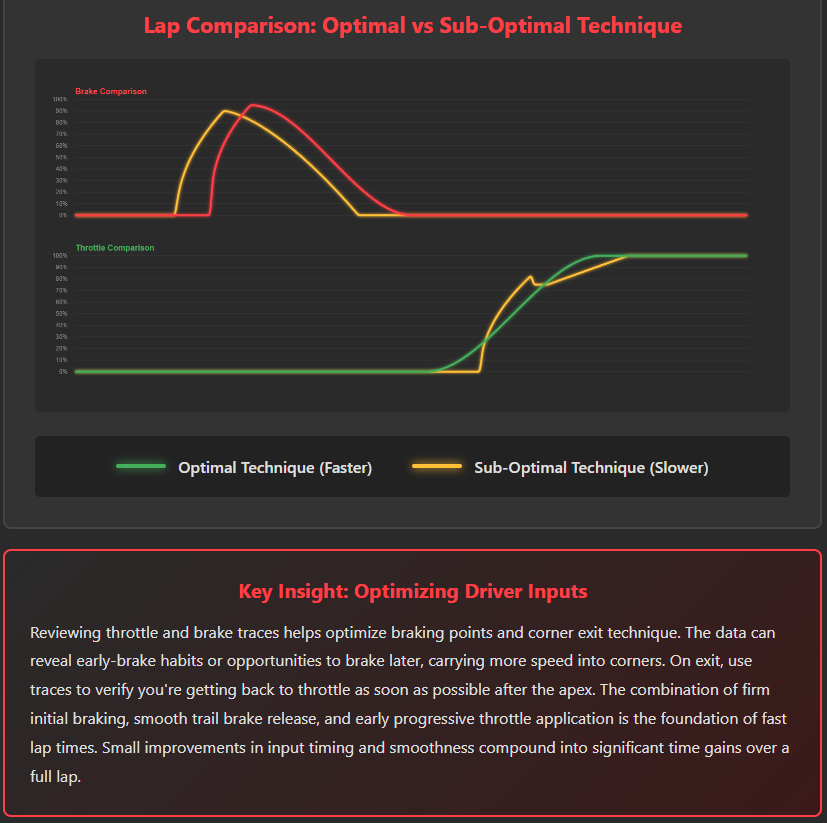
Throttle and brake traces can help you review how and when you used the pedals. They can show whether you braked consistently, released the brake smoothly, coasted too long, or returned to throttle earlier or later than expected. They can also help spot early-brake habits or opportunities to brake later. On exit, use traces to check if you’re getting back to throttle as soon as possible after the apex.
Optimizing braking: Review braking zones to see whether you are braking consistently, much earlier than expected, hesitating before turn-in, or releasing pressure inconsistently. Smooth, firm braking is key. These data can help spot any early-brake habits or opportunities to brake later and deeper into corners, improving both consistency and lap times.
Throttle and corner exit: Gradual and smooth throttle application can improve corner exits, maximize acceleration, minimize wheelspin, and reduce unnecessary corrections. Use these traces to check when you return to throttle and whether you apply it progressively or too abruptly.
G-Force Data: Maximizing Tire Grip
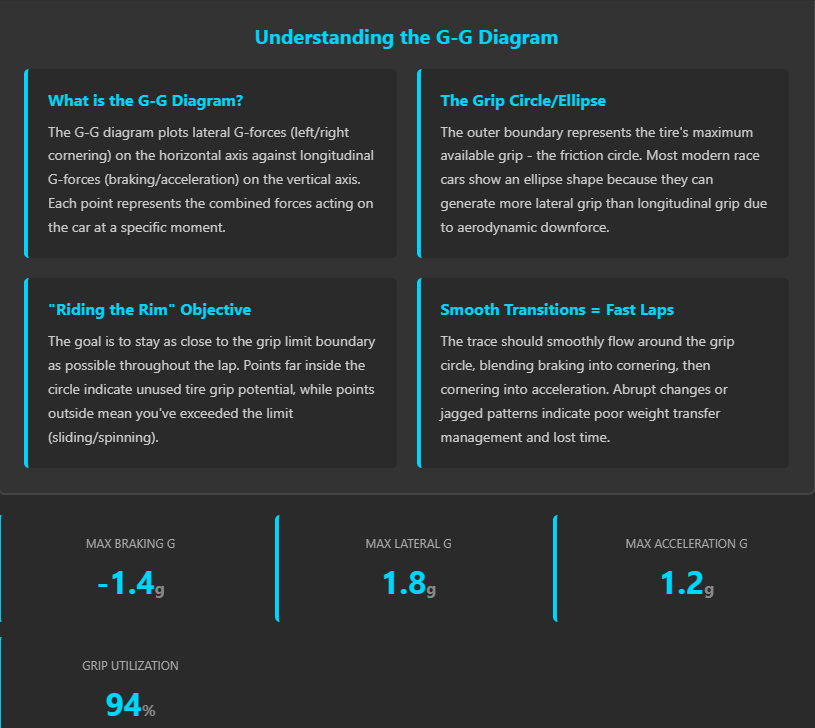
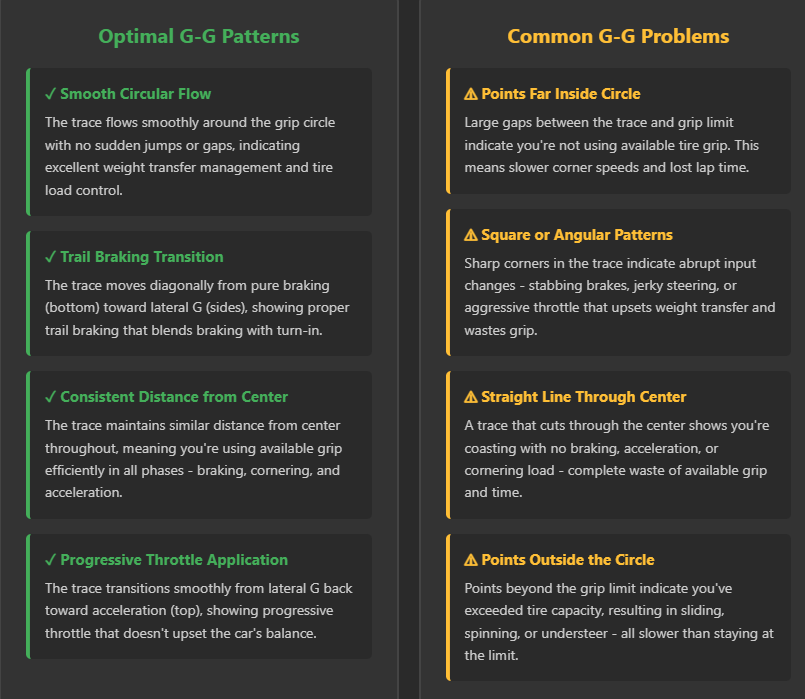
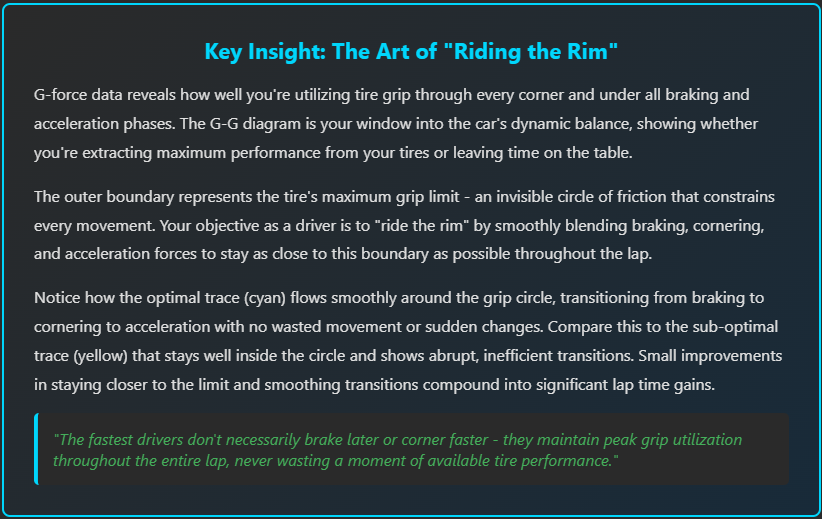
G-force data can show how the car is loading the tires under braking, cornering, and acceleration. It reveals how well you are utilizing the tire grip through corners and under braking/acceleration. The G-G Diagram helps ensure you are smoothly blending braking/acceleration with cornering, staying near the tire’s grip limit. Beginners do not need to master G-G diagrams immediately, but they can be useful for understanding smoothness and how inputs overlap.
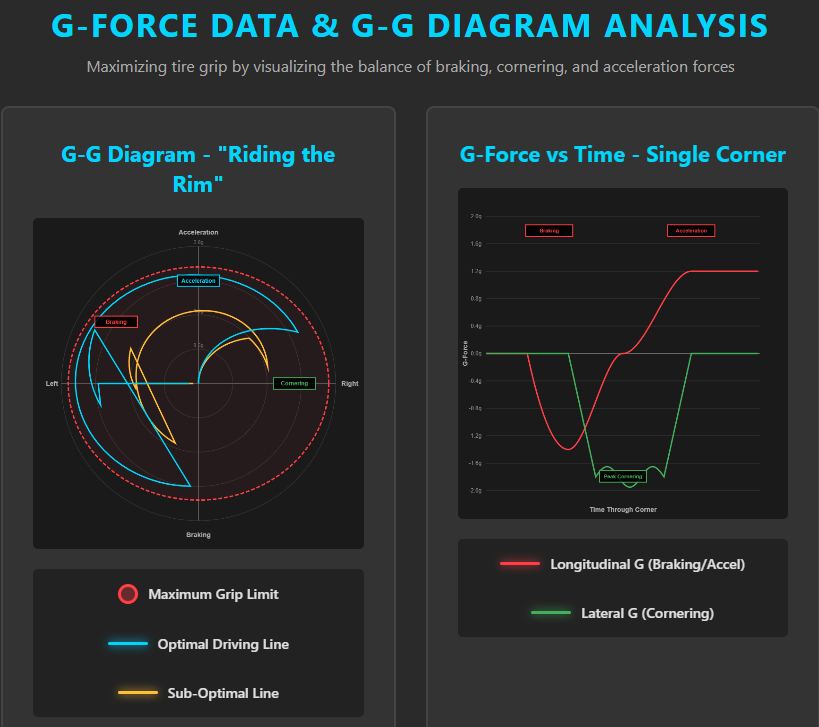
The outer shape of a G-G plot can help show how close the car is operating to the available grip. For HPDE review, the important lesson is usually not “use all the grip immediately.” It is to understand whether your inputs are smooth, consistent, and appropriate for the corner and conditions.
Tools and Resources for HPDE Data Analysis
Whether you use a phone app, dedicated GPS logger, camera, or full data system, the best tool is the one you can use consistently without distracting from event preparation, safety, instruction, or driving. Start simple, then add tools when you know what question you are trying to answer.
Smartphone Apps and Computer Software
- RaceRender — video/data overlay software
- TrackAddict by HP Tuners — data tool with OBD integration, RaceRender compatibility, and app vs software options for lap timing, data, and video workflows
- RaceChrono — customizable app option with predictive lap timing and data analysis
- Harry’s LapTimer — app option with comprehensive features and GPS tracking/lap timing
- Track Attack — cloud-based video/data platform combining video, data analysis, and team sharing capabilities
GPS Lap Timers and Data Loggers
Advanced tools can make review easier, especially as you start comparing more sessions or adding video and data channels. Before buying, verify compatibility with your car, mount location, event rules, software workflow, subscription requirements, return policy, and whether the tool helps answer your questions.
- RaceBox Mini — 25Hz GPS logger with 10cm precision and mobile app integration
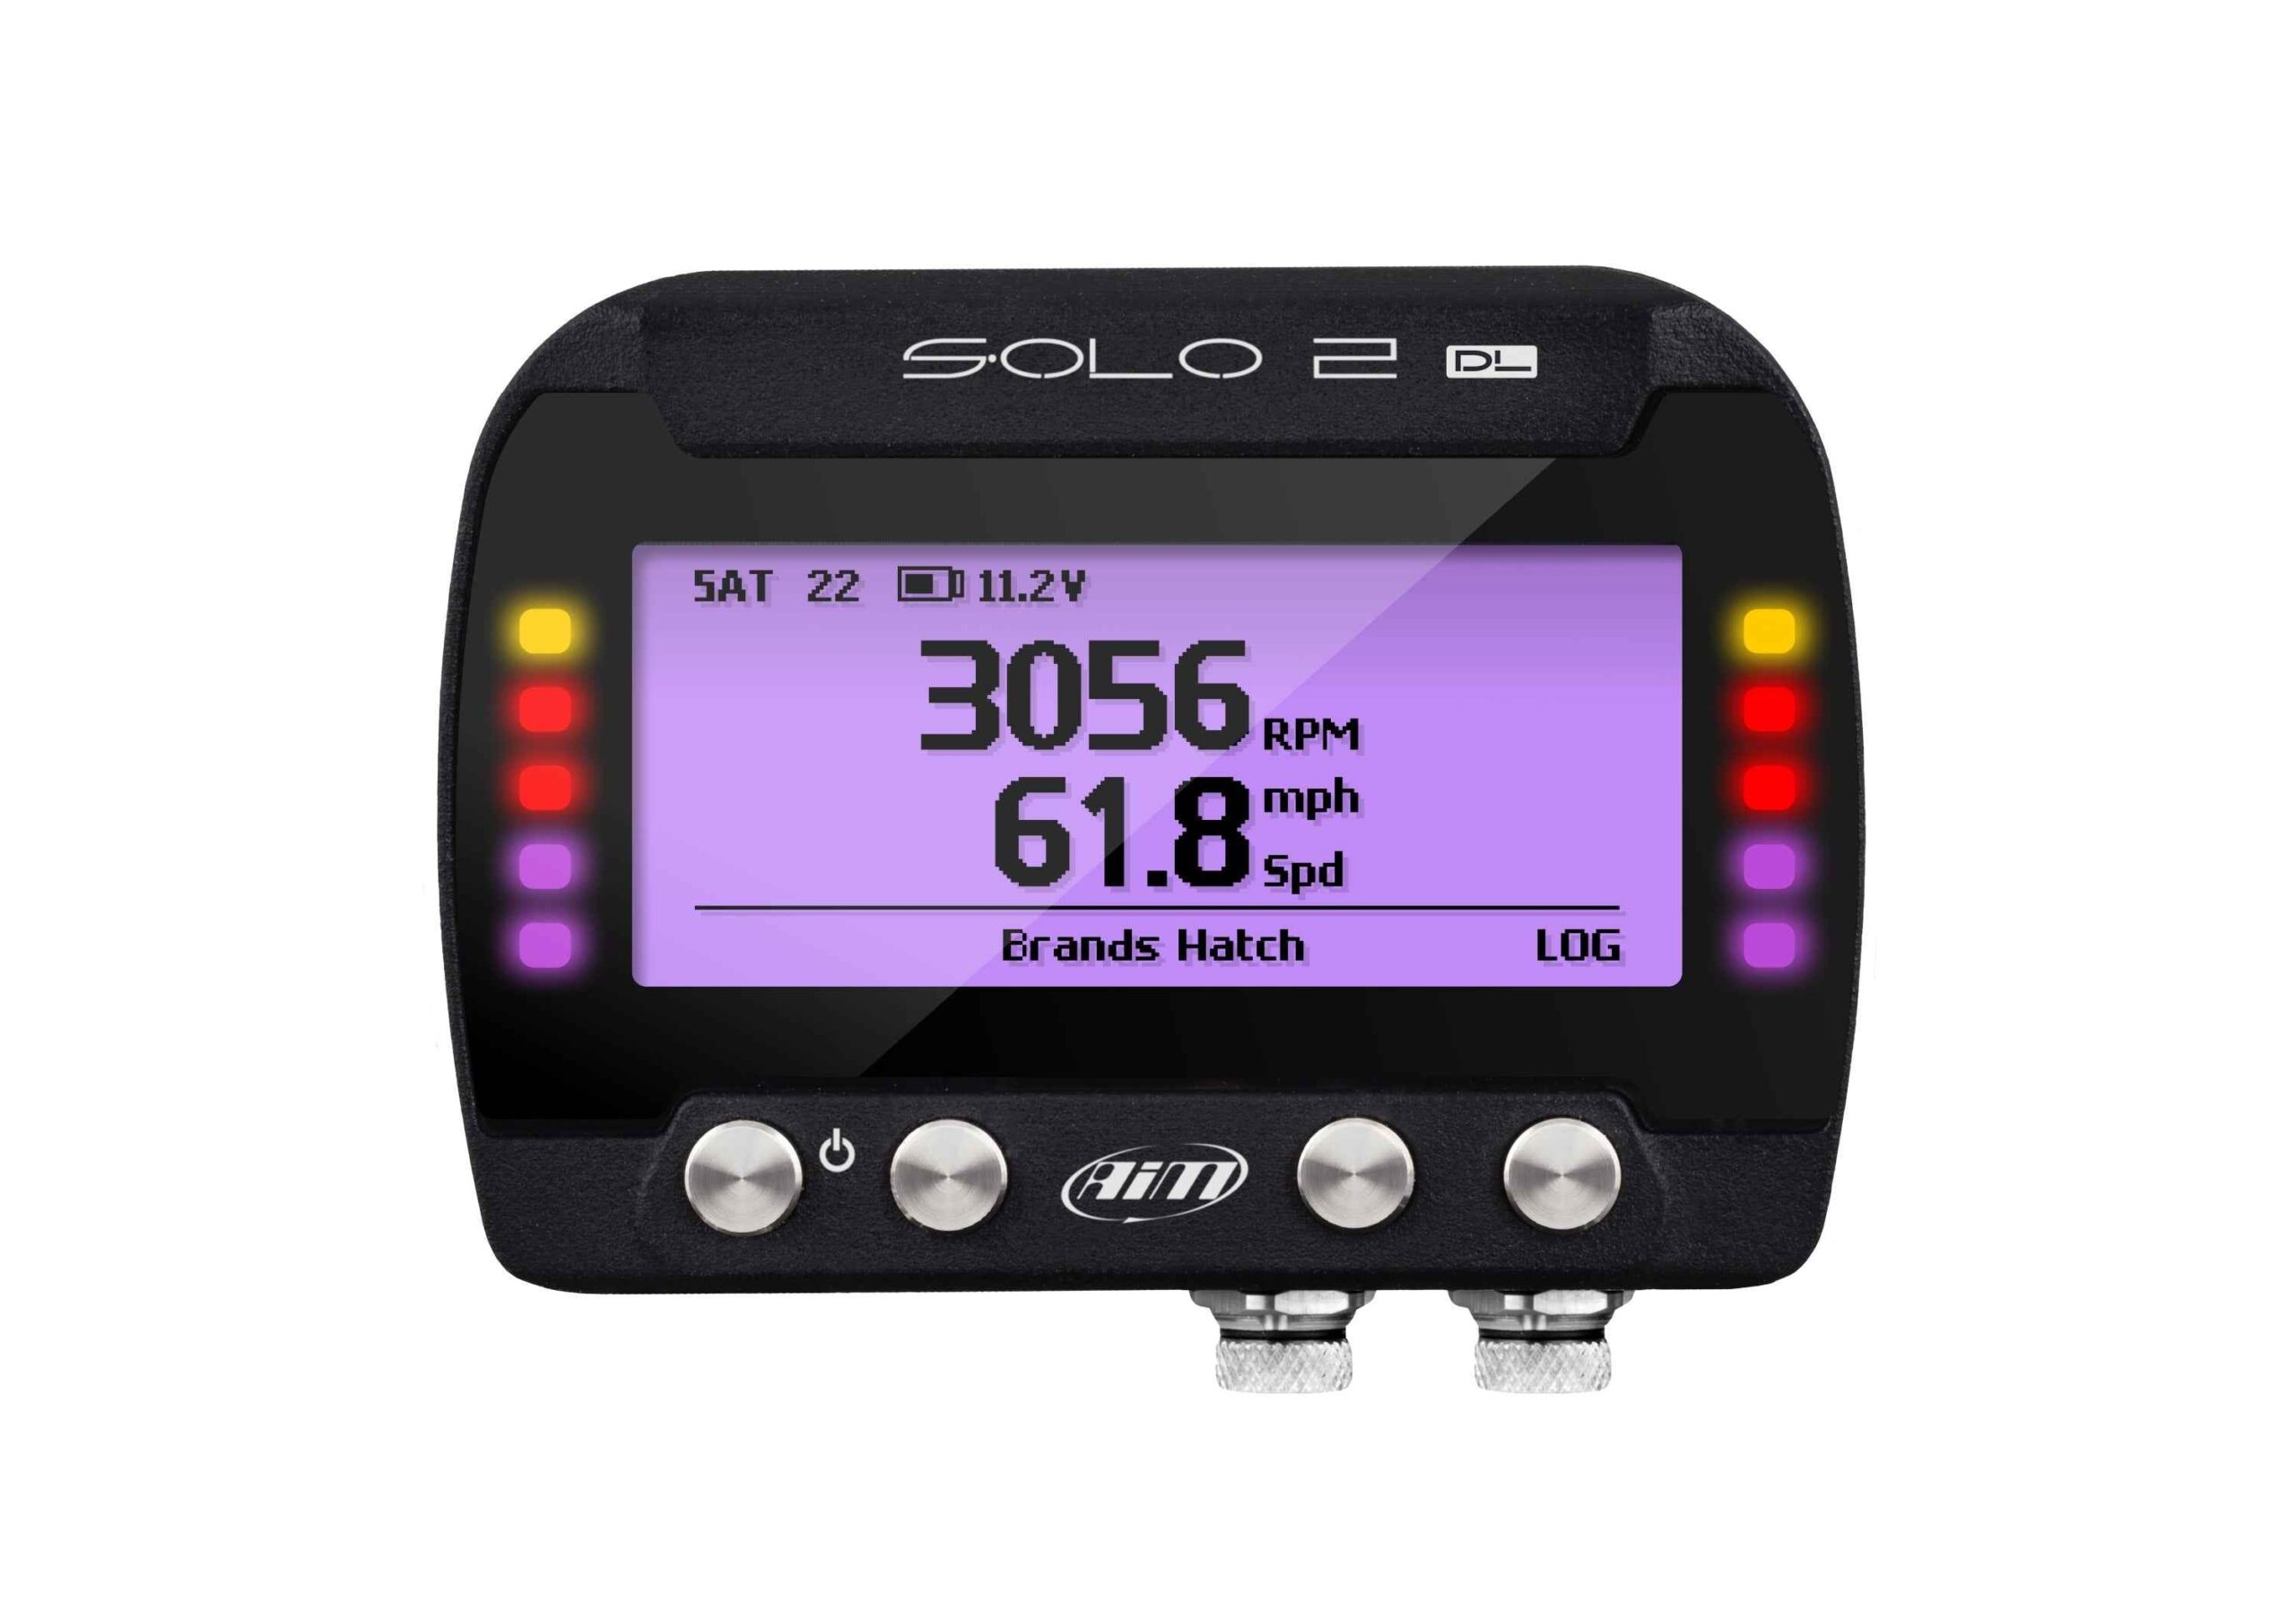
- AiM Solo 2 DL — GPS lap timer and data logger with a large track database and optional ECU connectivity
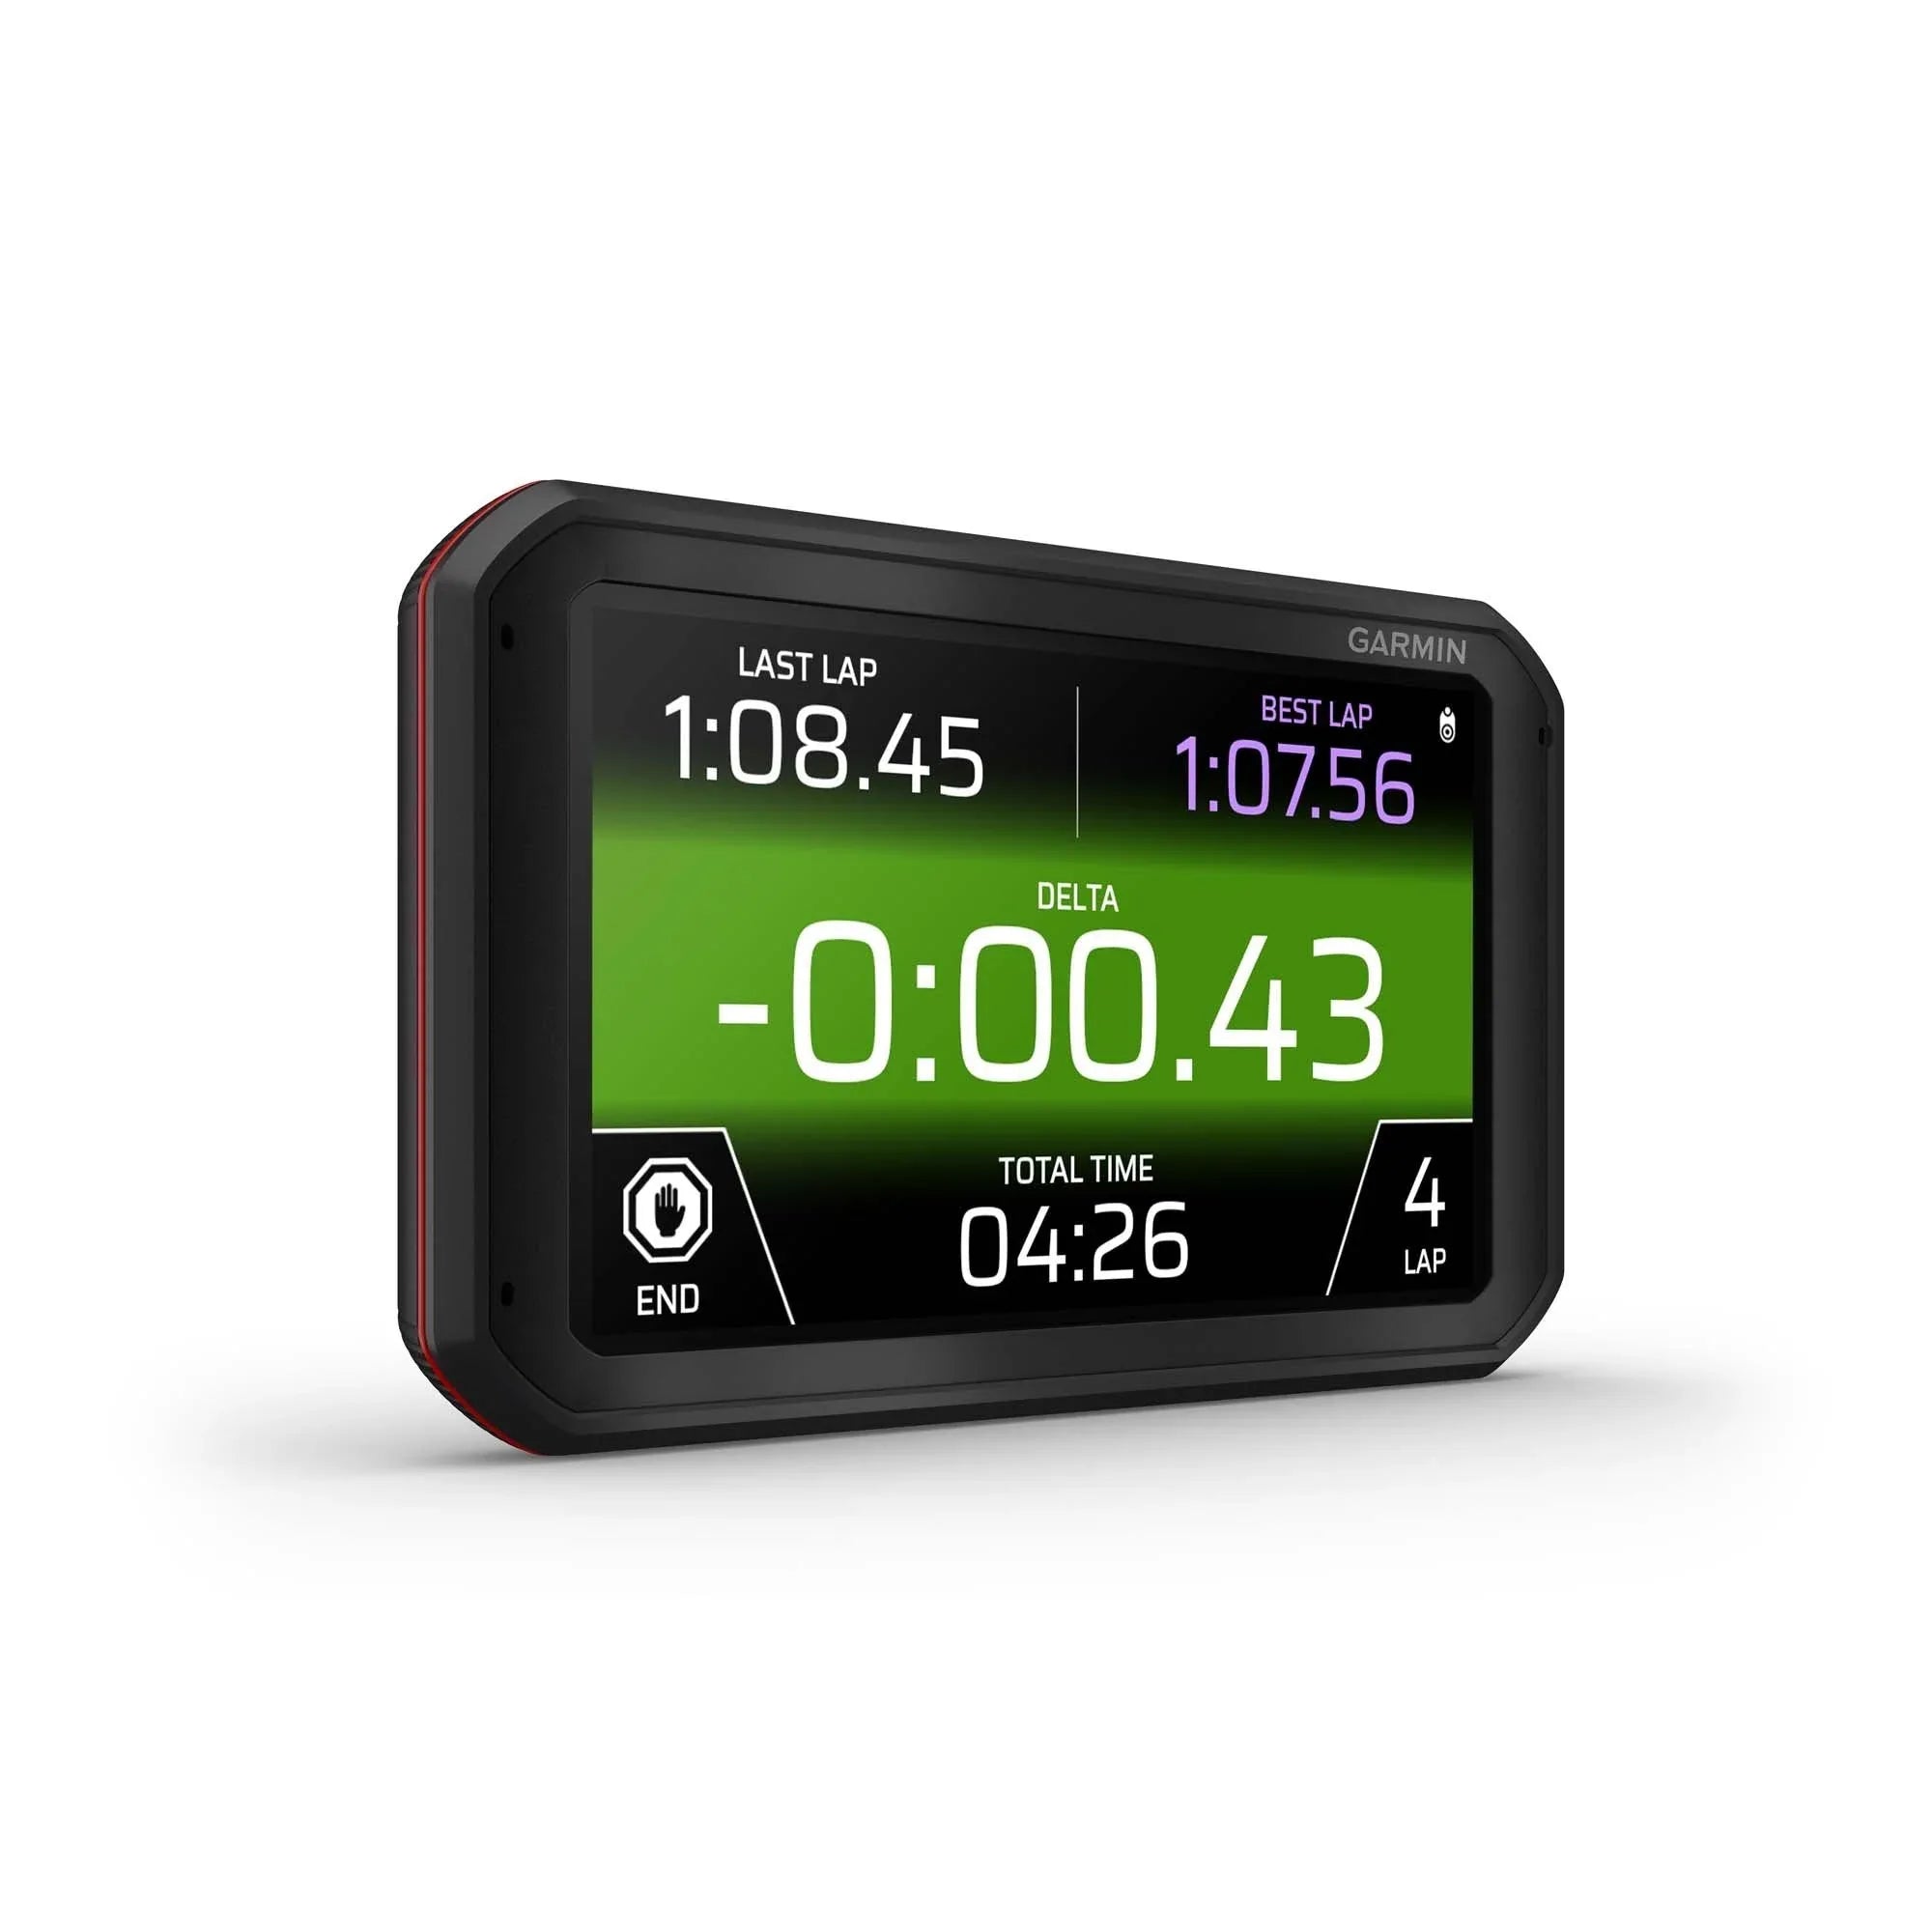
- Garmin Catalyst 2 — driver-performance tool offering trackside video/data review and coaching-style feedback
Video and Telemetry Tools
Video can make data easier to understand because it shows what was happening on track. A graph may show a speed drop, but video can reveal traffic, a point-by, a missed apex, a flag, or a different reference point.
- Action cameras, memory cards, mounts, and power solutions can support simple review workflows
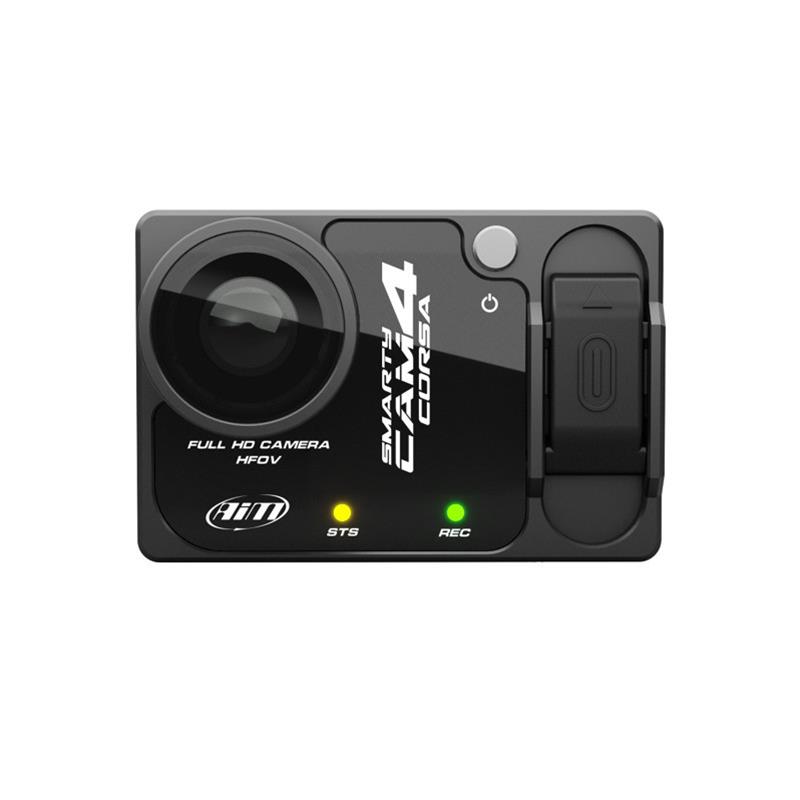
- AiM SmartyCam camera systems — integrated camera and data logger system with synchronized video / data overlay for AiM family loggers
Learning Resources
- HP Academy – Professional Motorsport Data Analysis – Comprehensive online course with webinars and active forum support
- Your Data Driven – Motorsports Data Analysis Course – Self-paced program focusing on practical driver development techniques
- Racing Car Dynamics – Fundamentals of Motorsport Data Analysis – Track-proven methodology taught by professional race engineer Rodrigo Santos
- Fire Laps – AI-powered telemetry lap analysis with coaching insights. Use Promo code TRACKMINDED for 3 months free for any annual membership when joining at firelaps.com
- Best HPDE Books for Your First Track Day and Beyond
Review your data after each track day while it’s still fresh. Develop a habit of identifying just one or two actionable items for next time, rather than getting overwhelmed by options.
Common Data Analysis Mistakes
Data analysis is powerful, but only if approached purposefully. These are common mistakes:
- Obsessing over one hero lap: one fast lap may include traffic luck, unusual risk, or a mistake that happened to work out; focus on repeatable, consistent improvements
- Ignoring the basics: always make sure the app, camera, GPS, or logger is actually recording clean data
- Trying to fix everything at once: pick one area per session for more noticeable progress
- Ignoring data: neglecting objective evidence in favor of “gut feel”—let data complement your instincts, not replace them
- Using data to replace coaching: data should support instruction, not replace it; good instructors will also review your data with you
Above all, remember that data is a tool. Use it to improve your driving, not complicate it.
How to Know Where and How to Improve
HPDE data analysis emphasizes continuous improvement. After each session, look for repeatable patterns instead of one-off surprises.
- Compare clean laps from similar conditions
- Look for corners where your approach, line, or speed changes lap to lap
- Find where speed traces dip suddenly or recover late
- Use segment times to identify which sections carry the biggest time differences
- Use video and instructor notes to explain why the data looks the way it does
By tracking progress across multiple sessions, you can notice trends and patterns. This feedback loop becomes more useful as your driving becomes more consistent.
Making Data Analysis a Habit
As with any training, consistency pays the biggest dividends. After each track day, spend a few minutes reviewing your data while the sessions are still fresh in your mind. Keep a notebook, spreadsheet, or digital log with your key findings and goals for the next event.
Share and discuss your observations with instructors or experienced driver friends. Outside perspectives often spot improvement opportunities you might miss.
Most importantly, treat HPDE data analysis as a learning tool, not a test. The best review makes your next session simpler, more focused, and easier to discuss with a coach.
Track Minded Take
HPDE data analysis is not about proving you are fast. It is about turning laps into better questions, clearer notes, and more focused practice. Start with clean laps, video, GPS traces, and instructor feedback. Add more tools only when they help answer specific questions.
Helpful Follow-Up Guides
FAQ
What data should I review after an HPDE session?
Start with session notes, instructor feedback, video, lap times, and one simple comparison such as a GPS trace or speed trace. Avoid reviewing too many channels at once.
Should HPDE beginners focus on lap times?
Usually not as the main goal. Lap times can show consistency, but beginners should prioritize awareness, smooth inputs, predictable driving, event rules, and instructor feedback before chasing faster laps.
How do speed traces help drivers improve?
Speed traces can show where you slowed, where minimum speed changed, and where you returned to throttle. They are most useful when paired with video, traffic context, and instructor feedback.
Are GPS traces useful for HPDE drivers?
Yes, when reviewed carefully. GPS traces can show line differences from lap to lap, but they should be interpreted with traffic, flags, conditions, run-group rules, and instructor guidance in mind.
When should I buy a dedicated data logger?
Consider a dedicated logger after you know what question you are trying to answer. Many drivers should start with notes, video, and a simple app before buying more advanced equipment.
Can data analysis replace an instructor?
No. Data can support driver development, but it should not replace professional instruction, event rules, flags, point-by procedures, or track-specific coaching.
Disclaimer:
For educational use only. Not a substitute for professional advice. Consult an expert before use. Track Minded HPDE, LLC is not liable for any injuries, damages, or losses resulting from use.